Account Analysis
Stop trading blind. Get deep insights into your performance, understand your edge, and make data-driven decisions with comprehensive account analytics.
Are You Really Profitable?
Most traders have no idea if they're actually making money. Without proper analytics, you're flying blind – unable to identify what's working, what's not, and where you're losing money.
Turn Raw Data Into Actionable Intelligence
Equity Curve & Drawdown Analysis
See how your account grew trade by trade, and how far it fell from each high, on an equity curve built from your closed trades.
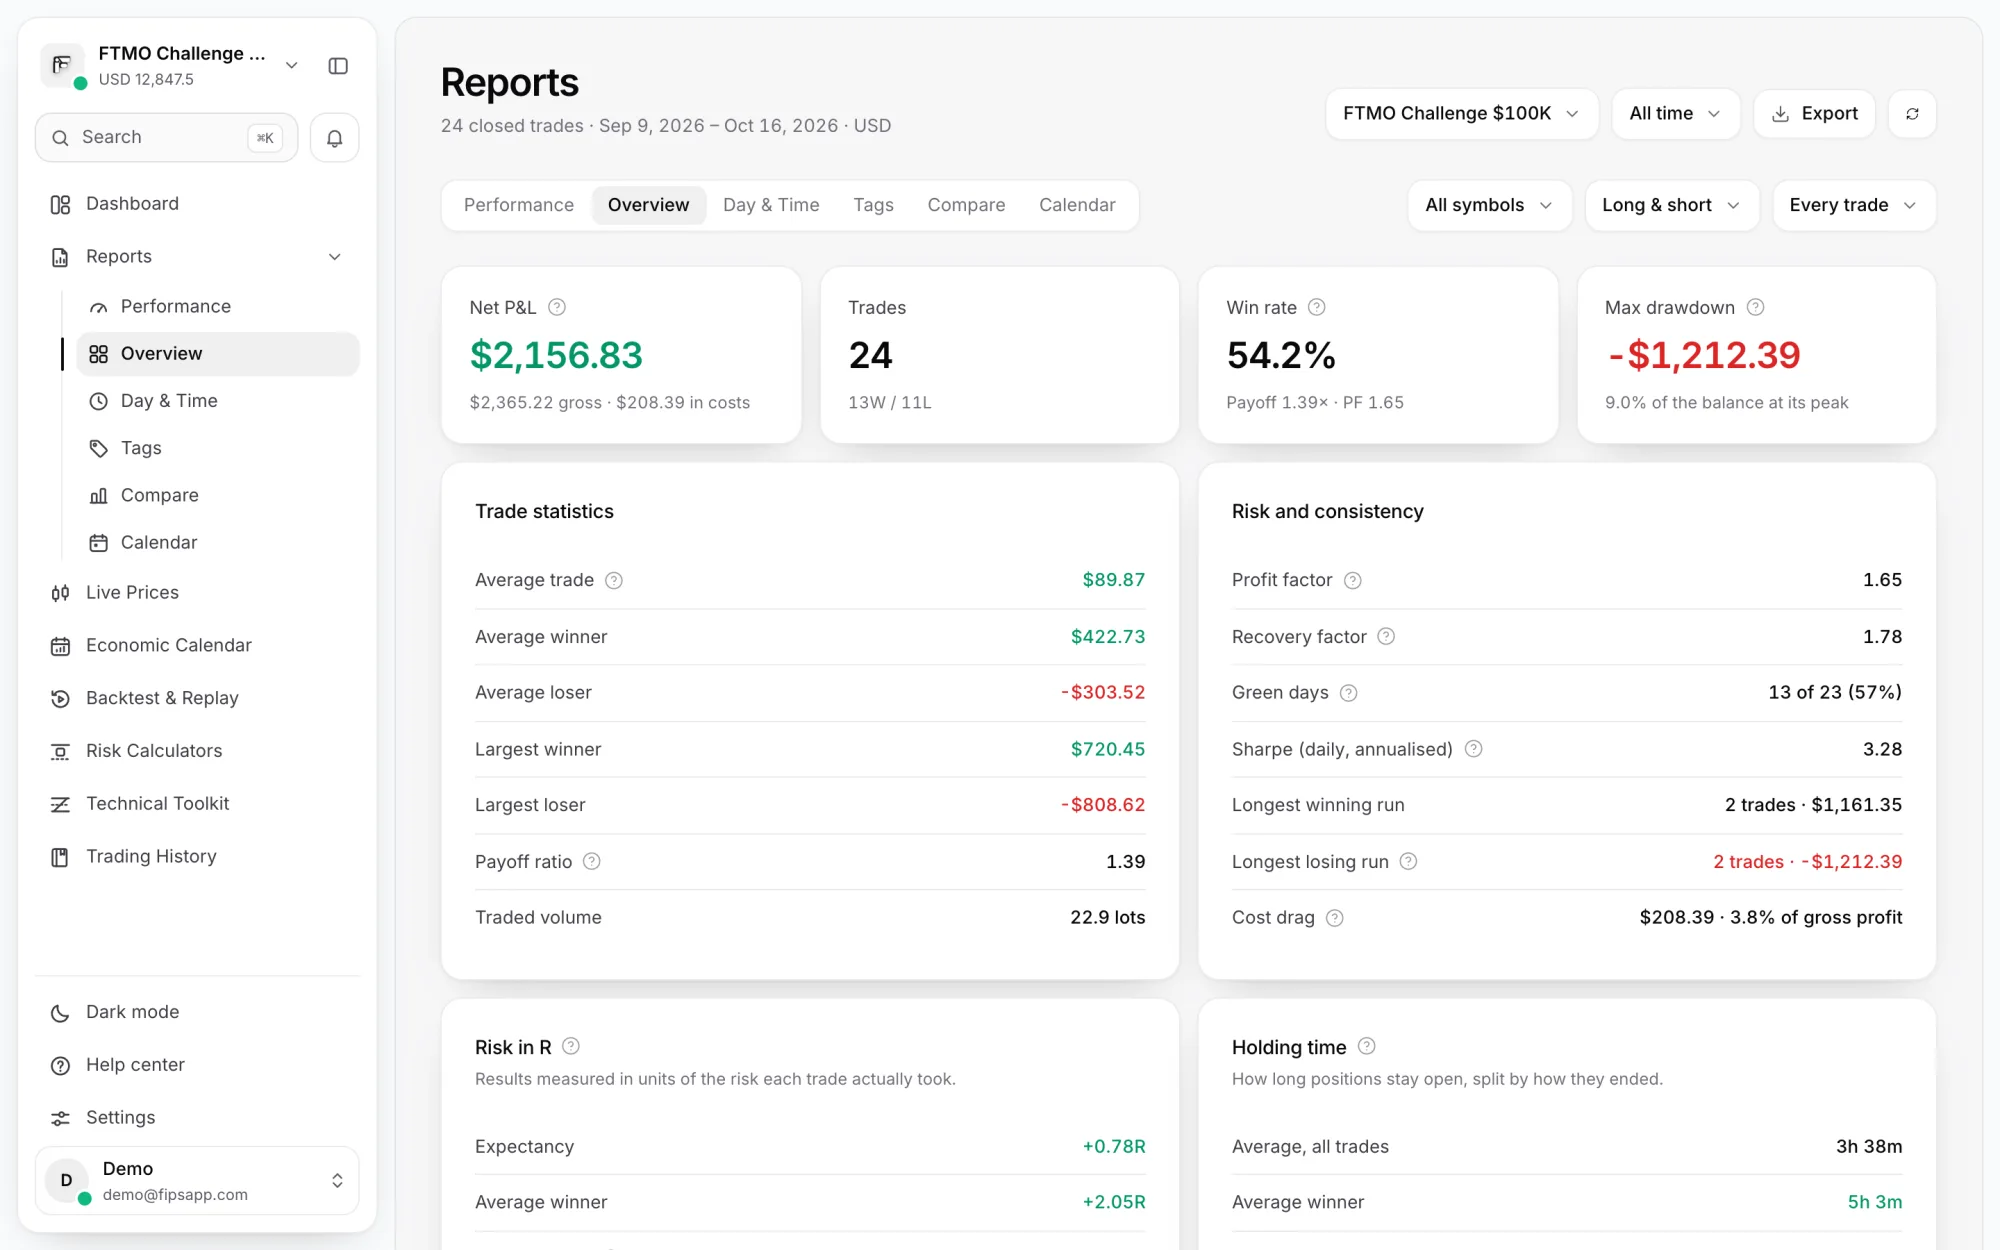
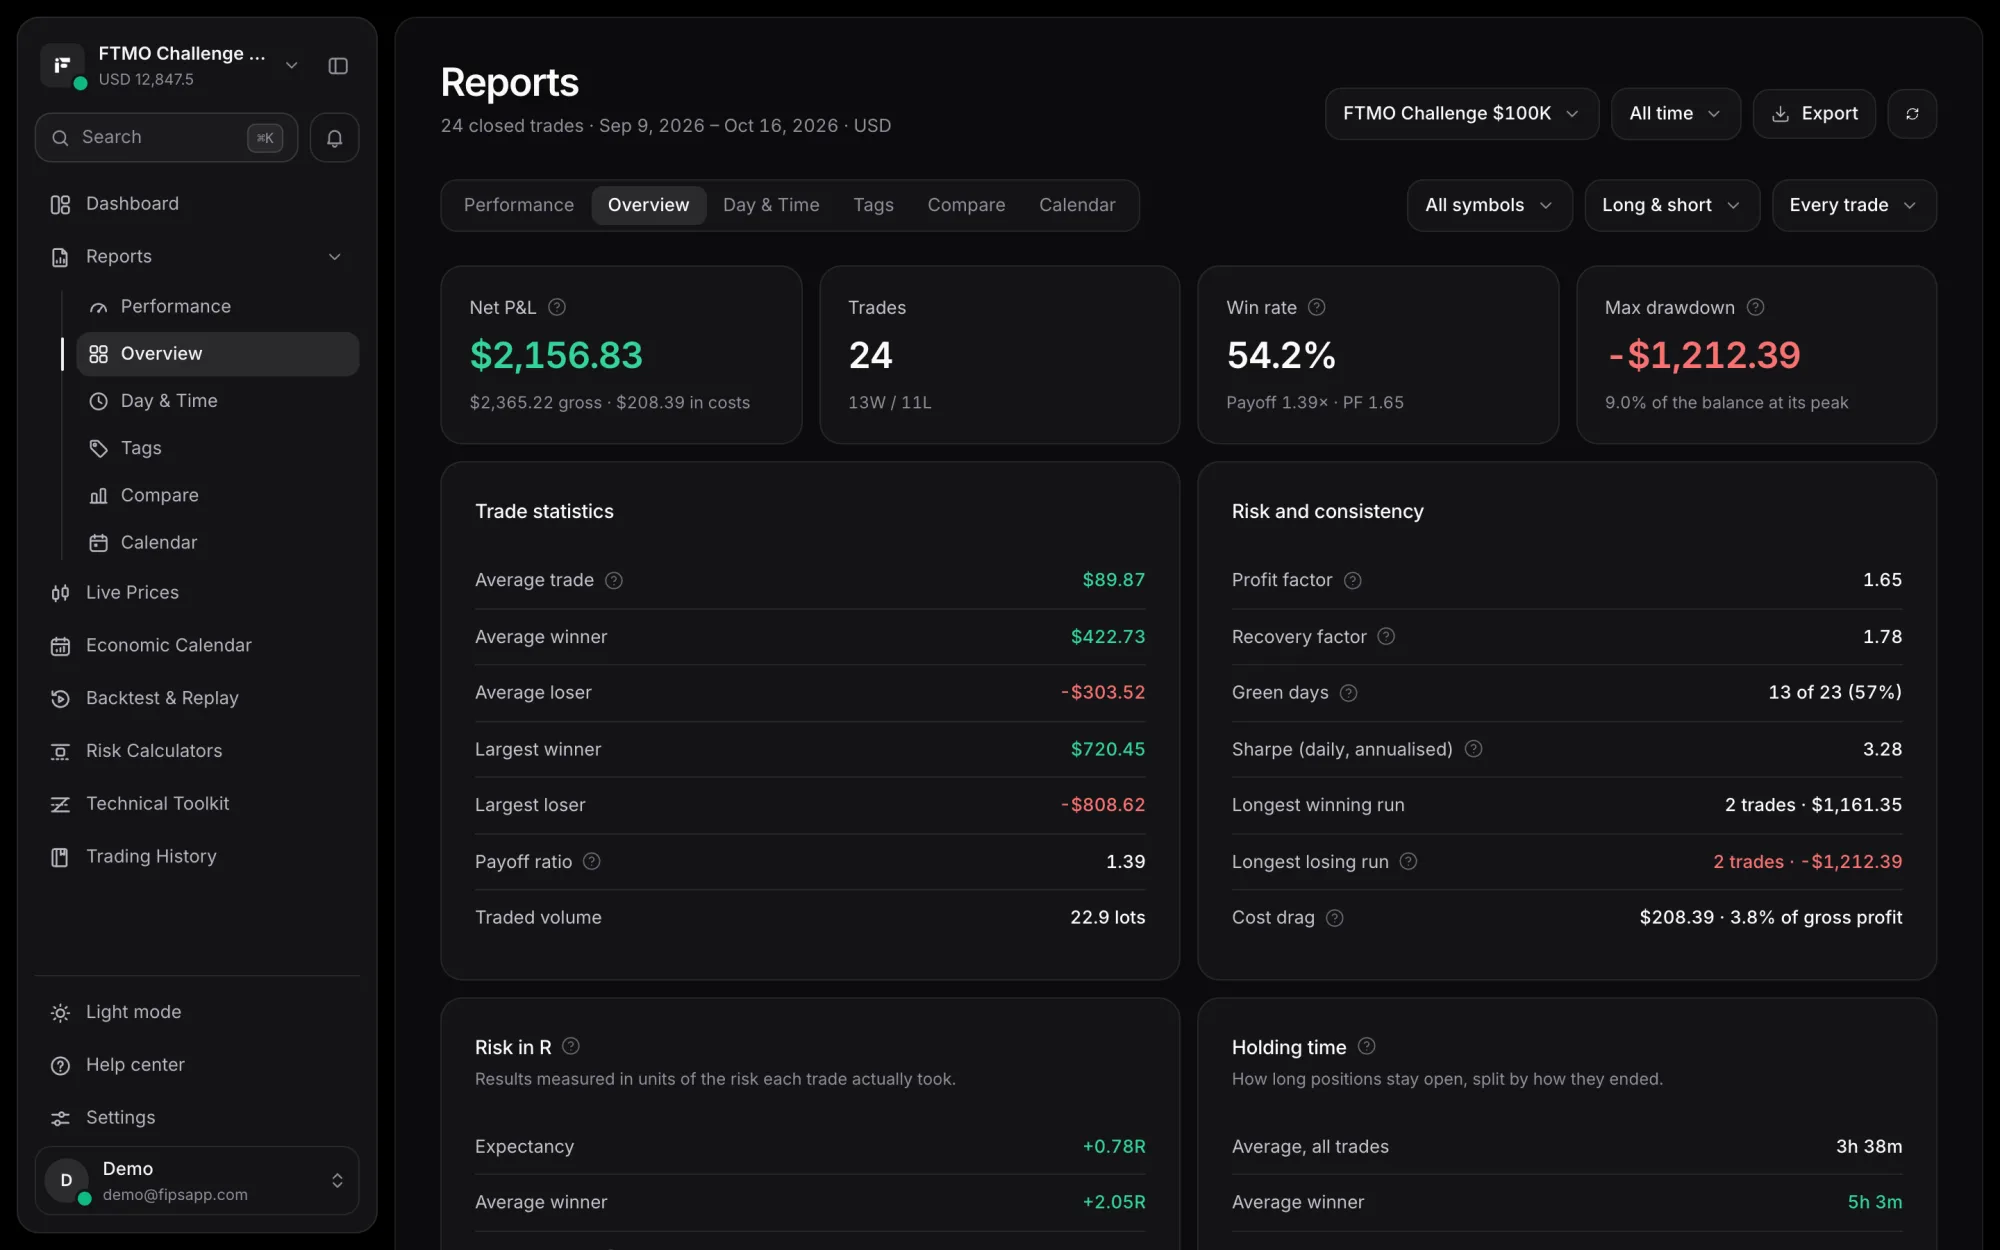
The curve follows your trades in the order they closed. Max drawdown is shown in money and, when the account balance is known, as a share of the balance at its peak, next to the recovery factor: net profit divided by that drawdown. The longest winning and losing runs show what a streak has actually cost you.
Win Rate & Profit Factor
Know your true edge with statistics broken down by symbol, time of day and setup.
Win rate, payoff ratio, profit factor, average winner and loser, and expectancy per trade, in money and in R for trades with a stop. Break results down by symbol, long or short, weekday, hour of entry, holding time and journal tag (setup, mistake, emotion, grade) to find the setups that actually pay.
Multi-Broker Portfolio Tracking
Bring trading accounts from different brokers and platforms into one dashboard.
Report on one account or all of them together, and compare accounts, instruments and long against short side by side. Track performance across MT4, MT5, cTrader and other platforms, synced automatically or imported by CSV.
Frequently Asked Questions
Yes. You can add accounts from different brokers and platforms. Reports cover one account or all of them together, and the Compare tab puts accounts side by side.
MT4, MT5, cTrader, Interactive Brokers and crypto exchange accounts sync automatically through read-only access. Trades imported by CSV update whenever you run a new import.
Net P&L, win rate, payoff ratio, profit factor, average winner and loser, expectancy (in money, and in R for trades with a stop), max drawdown, recovery factor, green days, a daily Sharpe ratio (annualised, shown once there are at least ten trading days), the longest winning and losing runs, and cost drag from commission and swap. Breakdowns cover symbol, direction, weekday, hour, holding time, month, account and journal tag, plus a P&L calendar.
Yes. Every report exports the trades behind it as a CSV file, with your filters applied, so you can check each number in a spreadsheet.
Learn More About Trading

Start Making Data-Driven Trading Decisions
Stop guessing, start knowing. Core analytics features are free forever. No credit card required.