Backtesting Trading Strategies: Complete Beginner's Guide
Learn how to test your trading strategies on historical data to find an edge before risking real money

What is Backtesting?
Backtesting is the process of testing a trading strategy using historical price data to see how it would have performed in the past.
Think of it as a "dress rehearsal" for your strategy before you put real money on the line.
"If you don't know your strategy's historical performance, you're gambling, not trading."
Why Backtest Your Strategy?
1. Validate Your Edge
Before risking capital, you need to know:
- Does this strategy actually work?
- What's the win rate?
- What's the expected profit per trade?
- What's the maximum drawdown?
2. Build Confidence
When you're in a losing streak, backtested data tells you:
- "This is normal for this strategy"
- "The edge is still there, keep going"
Without backtesting, you'll abandon good strategies during normal drawdowns.
3. Optimize Parameters
Testing helps you find optimal:
- Entry rules
- Exit rules
- Stop loss placement
- Take profit levels
- Position sizing
4. Understand Drawdowns
Every strategy has losing periods. Backtesting reveals:
- Maximum consecutive losses
- Longest drawdown period
- Worst-case scenarios
Types of Backtesting
Manual Backtesting
Scrolling through historical charts and manually recording each trade.
Pros:
- Develops chart reading skills
- Forces you to understand the strategy
- No coding required
Cons:
- Time-consuming
- Prone to human bias
- Hard to test many variations
Automated Backtesting
Using software to automatically test your strategy on historical data.
Pros:
- Fast (test years of data in seconds)
- No emotional bias
- Easy to optimize parameters
Cons:
- Requires coding or specialized software
- May miss nuances
- Can lead to over-optimization
Hybrid Approach
Use automated testing for initial screening, then manual testing for final validation.
This is what we recommend at Fips.
How to Backtest Manually (Step-by-Step)
Step 1: Define Your Strategy Rules
Write down EXACT rules for:
Entry:
- What conditions must be met?
- What timeframe?
- What confirmation?
Exit:
- Where is the stop loss?
- Where is the take profit?
- Any trailing rules?
Example Strategy:
Entry:
- Price closes above 20 EMA
- RSI crosses above 30
- Volume above average

Stop Loss:
- Below the recent swing low

Take Profit:
- 2x the stop loss distance (1:2 R:R)
Step 2: Choose Your Testing Period
Minimum recommended:
- Forex: 2-5 years
- Stocks: 5-10 years
- Crypto: 1-2 years (markets are young)
Include different market conditions:
- Trending periods
- Ranging periods
- High volatility (news events)
- Low volatility
Step 3: Scroll Through Charts
- Go back to the start of your test period
- Move forward bar by bar
- When you see a setup, record it
- Track entry, exit, P/L
- Continue until you reach present day
Step 4: Record Every Trade
Use a spreadsheet or trading journal:
| Date | Pair | Entry | Exit | Stop | TP | Result | R:R | Notes | |------|------|-------|------|------|----|---------|----|-------| | 2025-01-15 | EURUSD | 1.0850 | 1.0890 | 1.0830 | 1.0890 | Win | 1:2 | Clean setup | | 2025-01-18 | EURUSD | 1.0920 | 1.0900 | 1.0900 | 1.0960 | Loss | 1:2 | False breakout |
Step 5: Analyze Results
Calculate key metrics:
- Win Rate: Wins / Total Trades
- Risk:Reward: Average Win / Average Loss
- Expectancy: (Win% × Avg Win) - (Loss% × Avg Loss)
- Max Drawdown: Largest peak-to-trough decline
Key Backtesting Metrics Explained
Win Rate
Win Rate = Winning Trades / Total Trades × 100
What's a good win rate?
It depends on your R:R:
| R:R Ratio | Required Win Rate to Break Even | |-----------|--------------------------------| | 1:1 | 50% | | 1:2 | 33% | | 1:3 | 25% | | 1:4 | 20% |
A 40% win rate is profitable with 1:2 R:R!
Expectancy (The Most Important Metric)
Expectancy = (Win% × Average Win) - (Loss% × Average Loss)
Example:
- Win rate: 45%
- Average win: $200
- Average loss: $100
Expectancy = (0.45 × $200) - (0.55 × $100) = $90 - $55 = $35 per trade
Positive expectancy = profitable strategy.
Maximum Drawdown
The largest decline from peak equity to trough.
Example:
- Account grows from $10,000 to $15,000
- Then drops to $12,000
- Max Drawdown = ($15,000 - $12,000) / $15,000 = 20%
Acceptable drawdowns:
| Max Drawdown | Risk Level | |--------------|------------| | Under 10% | Conservative | | 10-20% | Moderate | | 20-30% | Aggressive | | Over 30% | Very risky |
Profit Factor
Profit Factor = Gross Profit / Gross Loss
- Below 1.0: Losing strategy
- 1.0-1.5: Mediocre
- 1.5-2.0: Good
- Above 2.0: Excellent
Common Backtesting Mistakes
Mistake 1: Curve Fitting / Over-Optimization
Problem: Tweaking parameters until they work perfectly on historical data.
Example: "I made this indicator work by using a 17.5-period moving average with RSI(13) and only trading on Tuesdays between 2-3 PM."
This won't work in live trading.
Solution: Keep rules simple. If it works, it should work on multiple timeframes and instruments.
Mistake 2: Ignoring Spread and Slippage
Problem: Your backtest shows $500 profit, but you ignored $200 in spread costs.
Solution: Always account for:
- Spread (entry and exit)
- Commission (if applicable)
- Slippage (especially on fast moves)
Mistake 3: Look-Ahead Bias
Problem: Using information that wouldn't have been available at the time of the trade.
Example: "I entered because I could see the candle closed bullish" - but in real-time, you couldn't know how the candle would close.
Solution: Only use information available at the moment of decision.
Mistake 4: Survivorship Bias
Problem: Only testing on instruments that exist today, ignoring ones that failed.
Example: Testing on current S&P 500 stocks ignores companies that went bankrupt.
Solution: Use point-in-time data that includes delisted stocks.
Mistake 5: Too Short Testing Period
Problem: "My strategy worked great for 3 months!"
Reality: That's not statistically significant.
Solution: Minimum 100+ trades across multiple market conditions.
Mistake 6: Cherry-Picking Trades
Problem: "I only took trades that looked good in hindsight."
Solution: Take EVERY signal that matches your rules, not just the pretty ones.
Using Fips for Backtesting
Our Backtesting Module helps you:
- ✅ Test strategies on historical data
- ✅ Record manual backtests efficiently
- ✅ Calculate all key metrics automatically
- ✅ Compare multiple strategies
- ✅ Export results for analysis
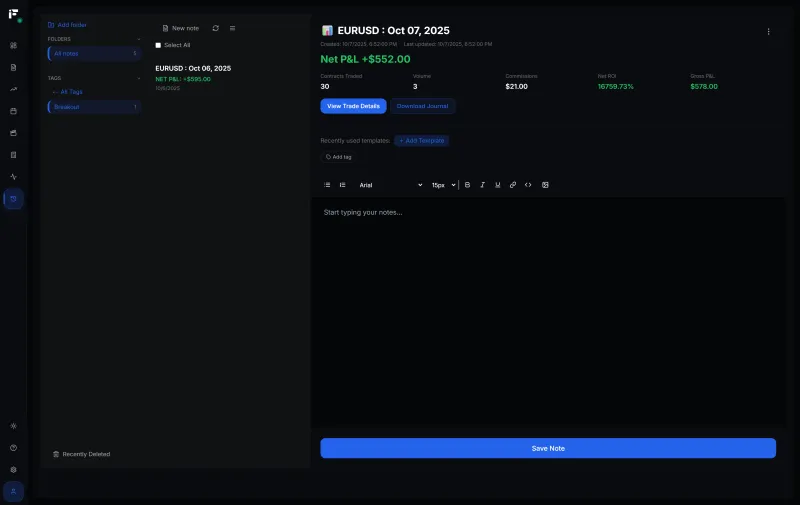
Combined with our Trading Journal, you can:
- Track live trades against backtested expectations
- Identify when live performance deviates
- Continuously improve your edge
Forward Testing: The Next Step
After backtesting, do forward testing (paper trading):
- Trade your strategy in real-time
- But with fake money
- Track results for 2-3 months
- Compare to backtested results
If they match, you're ready for live trading.
Sample Backtest Report
Here's what a complete backtest report should look like:
Strategy: EMA Crossover with RSI Filter
Period: January 2023 - December 2025
Instrument: EUR/USD
Timeframe: 4-hour

RESULTS:
Total Trades: 156
Winning Trades: 71 (45.5%)
Losing Trades: 85 (54.5%)

Average Win: $320
Average Loss: $150
Largest Win: $890
Largest Loss: $170

Expectancy: $63.60 per trade
Profit Factor: 1.68
Net Profit: $9,921

Maximum Drawdown: 12.3%
Maximum Consecutive Losses: 7
Longest Drawdown Period: 3 weeks

VERDICT: Profitable strategy with acceptable drawdown.
Suitable for live trading with proper position sizing.
Frequently Asked Questions
How many trades do I need for a valid backtest?
Minimum 100 trades, ideally 200+. Fewer trades means the results aren't statistically significant.
Can I trust backtest results?
Backtests are not guarantees. They show what COULD happen, not what WILL happen. Always account for:
- Market conditions change
- Your execution won't be perfect
- Emotions will affect you
How often should I re-backtest?
Re-test your strategy:
- Every 6-12 months
- When market conditions significantly change
- When you notice performance deterioration
What if my backtest shows losses?
That's valuable information! It means:
- Modify the strategy and retest
- Or abandon it before losing real money
A negative backtest result is a win—it saved you from losses.
Next Steps
- Try Our Backtesting Tool - Test your strategies
- Start a Trading Journal - Track live vs. backtested results
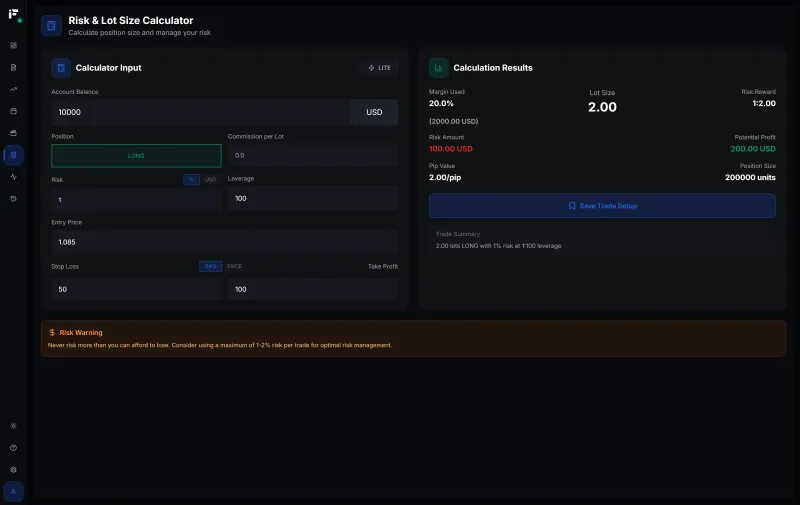
- Calculate Position Sizes - Proper sizing for your edge
- Read Risk Management Guide - Protect your capital
Related Resources:
- 📓 Trading Journal Complete Guide
- 🧮 Lot Size Calculator Guide
- 📊 Risk Management Guide
- 🎯 Trading Psychology Guide
Remember: A strategy without backtesting is just a guess. Professional traders test before they invest.
Emre Aktaş
Founder & Developer at Fips. Trader with 7+ years of experience in forex and crypto markets. Building tools to help traders succeed.
Related Articles
Margin Call Explained: How to Avoid and Survive It
Understand what causes margin calls, how to prevent them, and what to do if you face one in forex trading
Trading Psychology: Master Your Mindset for Consistent Profits
Learn how to control emotions, build discipline, and develop the mental edge that separates profitable traders from the rest
Position Size Calculator: How to Calculate Position Size in Forex
Master position sizing with our complete guide. Learn formulas, avoid common mistakes, and calculate perfect lot sizes for any trade